Market Outlook
June 30, 2017
Market Cues
Domestic Indices
Chg (%)
(Pts)
(Close)
Indian markets are likely to open flat with a negative bias tracking SGX Nifty,and
BSE Sensex
0.1
23
30,858
global indices but could remain under pressure during the day.
Nifty
0.1
13
9,504
The US markets ended the day with sharp selling. Though markets were off from
Mid Cap
0.3
50
14,552
day’s low the technology heavy NASADQ posted a bigger loss than Dow Jones.
Small Cap
1.0
149
15,310
Financials and Banking stocks witnessed strong buying while technology and
semiconductor companies were under selling pressure. In economic news the
Bankex
(0.1)
(21)
26,278
commerce department released a report showing stronger than previously estimated
US economic growth in the first quarter. The European markets started the day on
Global Indices
Chg (%)
(Pts)
(Close)
positive bias but closed on a weak note
Dow Jones
(0.8)
(168)
21,287
After witnessing selling pressure in the previous three trading sessions the Indian
Nasdaq
(1.4)
(90)
6,144
markets started the day with a positive not and gained further strength by mid day.
FTSE
(0.5)
(37)
7,350
However, most of the gains were earned by the end of the day and the broader
Nikkei
(00.4
90
20,220
indices ended almost flat with a marginal gain. F&O expiry together with nearing of
Hang Seng
1.1
282
25,965
GST implementation impacted the overall investor’s sentiment. As mentioned earlier
Shanghai Com
0.5
15
3,188
the markets might see some more weakness for next couple of trading session
before it starts consolidating and
Advances / Declines
BSE
NSE
News Analysis
Advances
1,632
1100
JSW Steel plans to build a slurry pipeline with an investment of ` 2,100 cr
Declines
1,958
549
Detailed analysis on Pg2
Unchanged
162
92
Investor’s Ready Reckoner
Volumes (` Cr)
Key Domestic & Global Indicators
BSE
3,956
Stock Watch: Latest investment recommendations on 150+ stocks
NSE
29,698
Refer Pg6 onwards
Top Picks
#Net Inflows (` Cr)
Net
Mtd
Ytd
CMP
Target
Upside
Company
Sector
Rating
(`)
(`)
(%)
FII
(1,141)
(22,439
54,408
Blue Star
Capital Goods
Buy
593
760
28.2
MFs
8600
7,182
37,221
Dewan Housing Fin. Financials
Buy
436
520
19.2
Mahindra Lifespace Real Estate
Buy
431
522
21.1
Top Gainers
Price (`)
Chg (%)
Navkar Corporation Others
Buy
212
265
25.0
KEI Industries
Capital Goods
Accumulate
231
258
11.5
Jpassociat
123
13.6
More Top Picks on Pg5
Gvkpil
7
13.1
Key Upcoming Events
Carerating
1,597
11.8
Previous
Consensus
Iifl
602
8.2
Date
Region
Event Description
Reading
Expectations
Sci
83
7.2
Jun 30, 2017 US
GDP Qoq (Annualised)
1.20
1.20
Jun 30, 2017 China
PMI Manufacturing
51.20
51.00
Jun 30, 2017 UK
PMI Manufacturing
56.70
Top Losers
Price (`)
Chg (%)
Jul 3, 2017
UK
GDP (YoY)
2.00
2.00
Pageind
16,220
(3.7)
Jul 3, 2017
Germany PMI Manufacturing
59.30
Gspl
168
(3.1)
More Events on Pg5
Monsanto
2,658
(2.4)
Havells
452
(2.3)
Orientbank
139
(2.2)
#as on 29t June, 2017
Market Outlook
June 30, 2017
News Analysis
JSW Steel Ltd plans to set up slurry pipeline in Karnataka for
` 2,100 cr for transportation of iron ore:
JSW Steel the leading steel producer in India plans to invest `2,100 cr in
Karnataka to build a slurry pipeline for transportation of Iron Ore. JSW Steel has
been operating its 12 MTPA integrated steel plant at Vijaya Nagar works in the
State of Karnataka. The company had invested huge sum in the plant relying upon
consistent supply of iron ore at a fair price. However, the supreme court of India
in order to curb the illegal mining in the state capped the mining in Karnataka at
30 Mn Tones p.a. Though four years has passed the current iron production in
Karnataka is below the demand level.
As per the company’s statement while the demand for iron ore has picked up and
not supply, taking the advantage of the same, the mines in the state are charging
a higher premium compared to other states like Odisha and Jharkhand for the
same grade of iron ore. Globally transporting iron ore via slurry pipeline is widely
used as it is environmentally friendly. The management believes, the proposed
slurry pipeline will allow the company in sourcing iron from other geographies and
thus will de-risk their raw material sourcing concentration.
Economic and Political News
Congress joins TMC, will skip midnight GST launch tomorrow
7th pay commission finally gets government nod
Petya Ransomware; India worst hit in Asia, seventh most affected globally.
Corporate News
Wipro, Infosys see decline in share of top-five clients in total revenues
Indigo expresses interest in, Air India privatization
Yes Bank launches tailor made programme for MSMEs
Market Outlook
June 30, 2017
Top Picks ★★★★★
Market Cap
CMP
Target
Upside
Company
Rationale
(` Cr)
(`)
(`)
(%)
Strong growth in domestic business due to its leadership
in acute therapeutic segment. Alkem expects to launch
Alkem Laboratories
22,194
1,856
2,161
16.4
more products in USA, which bodes for its international
business.
We expect the company would report strong profitability
Asian Granito
1,276
424
447
5.4
owing to better product mix, higher B2C sales and
amalgamation synergy.
Favourable outlook for the AC industry to augur well for
Cooling products business which is out pacing the market
Blue Star
5,671
593
760
28.2
growth. EMPPAC division's profitability to improve once
operating environment turns around.
With a focus on the low and medium income (LMI)
consumer segment, the company has increased its
Dewan Housing Finance
13,677
436
520
19.2
presence in tier-II & III cities where the growth opportunity
is immense.
Loan growth is likely to pick up after a sluggish FY17.
Karur Vysya Bank
8,841
146
160
9.4
Lower credit cost will help in strong bottomline growth.
Increasing share of CASA will help in NIM improvement.
Economic recovery to have favourable impact on
advertising & circulation revenue growth. Further, the
Jagran Prakashan
5,961
182
225
23.4
acquisition of a radio business (Radio City) would also
boost the company's revenue growth.
High order book execution in EPC segment, rising B2C
KEI Industries
1,800
231
258
11.5
sales and higher exports to boost the revenues and
profitability
Speedier execution and speedier sales, strong revenue
Mahindra Lifespace
2,213
431
522
21.1
visibilty in short-to-long run, attractive valuations
Massive capacity expansion along with rail advantage at
Navkar Corporation
3,024
212
265
25.0
ICD as well CFS augurs well for the company
Strong brands and distribution network would boost
Siyaram Silk Mills
1,875
2,000
2,500
25.0
growth going ahead. Stock currently trades at an
inexpensive valuation.
Market leadership in Hindi news genre and no.
2
viewership ranking in English news genre, exit from the
TV Today Network
1,420
238
344
44.5
radio business, and anticipated growth in ad spends by
corporates to benefit the stock.
Source: Company, Angel Research,
Market Outlook
June 30, 2017
Key Upcoming Events
Global economic events release calendar
Bloomberg Data
Date
Time
Country
Event Description
Unit
Period
Last Reported
Estimated
Jun 30, 2017
6:00 PMUS
GDP Qoq (Annualised)
% Change
1Q T
1.20
1.20
6:30 AMChina
PMI Manufacturing
Value
Jun
51.20
51.00
2:00 PMUK
PMI Manufacturing
Value
Jun
56.70
Jul 03, 2017
2:00 PMUK
GDP (YoY)
% Change
1Q F
2.00
2.00
1:25 PMGermany
PMI Manufacturing
Value
Jun F
59.30
Jul 05, 2017
1:25 PMGermany
PMI Services
Value
Jun F
53.70
Jul 07, 2017
2:00 PMUK
Industrial Production (YoY)
% Change
May
(0.80)
6:00 PMUS
Change in Nonfarm payrolls
Thousands
Jun
138.00
180.00
6:00 PMUS
Unnemployment rate
%
Jun
4.30
4.30
Jul 10, 2017
India
Imports YoY%
% Change
Jun
33.10
India
Exports YoY%
% Change
Jun
8.30
7:00 AMChina
Consumer Price Index (YoY)
% Change
Jun
1.50
1.50
Jul 12, 2017
2:00 PMUK
Jobless claims change
% Change
Jun
7.30
5:30 PMIndia
Industrial Production YoY
% Change
May
3.10
Jul 13, 2017
China
Exports YoY%
% Change
Jun
8.70
US
Producer Price Index (mom)
% Change
Jun
(0.70)
Jul 14, 2017
6:45 PMUS
Industrial Production
%
Jun
-
6:00 PMUS
Consumer price index (mom)
% Change
Jun
(0.10)
12:00 PMIndia
Monthly Wholesale Prices YoY%
% Change
Jun
2.17
Jun 30, 2017
6:00 PMUS
GDP Qoq (Annualised)
% Change
1Q T
1.20
1.20
6:30 AMChina
PMI Manufacturing
Value
Jun
51.20
51.00
Source: Bloomberg, Angel Research
Market Outlook
June 30, 2017
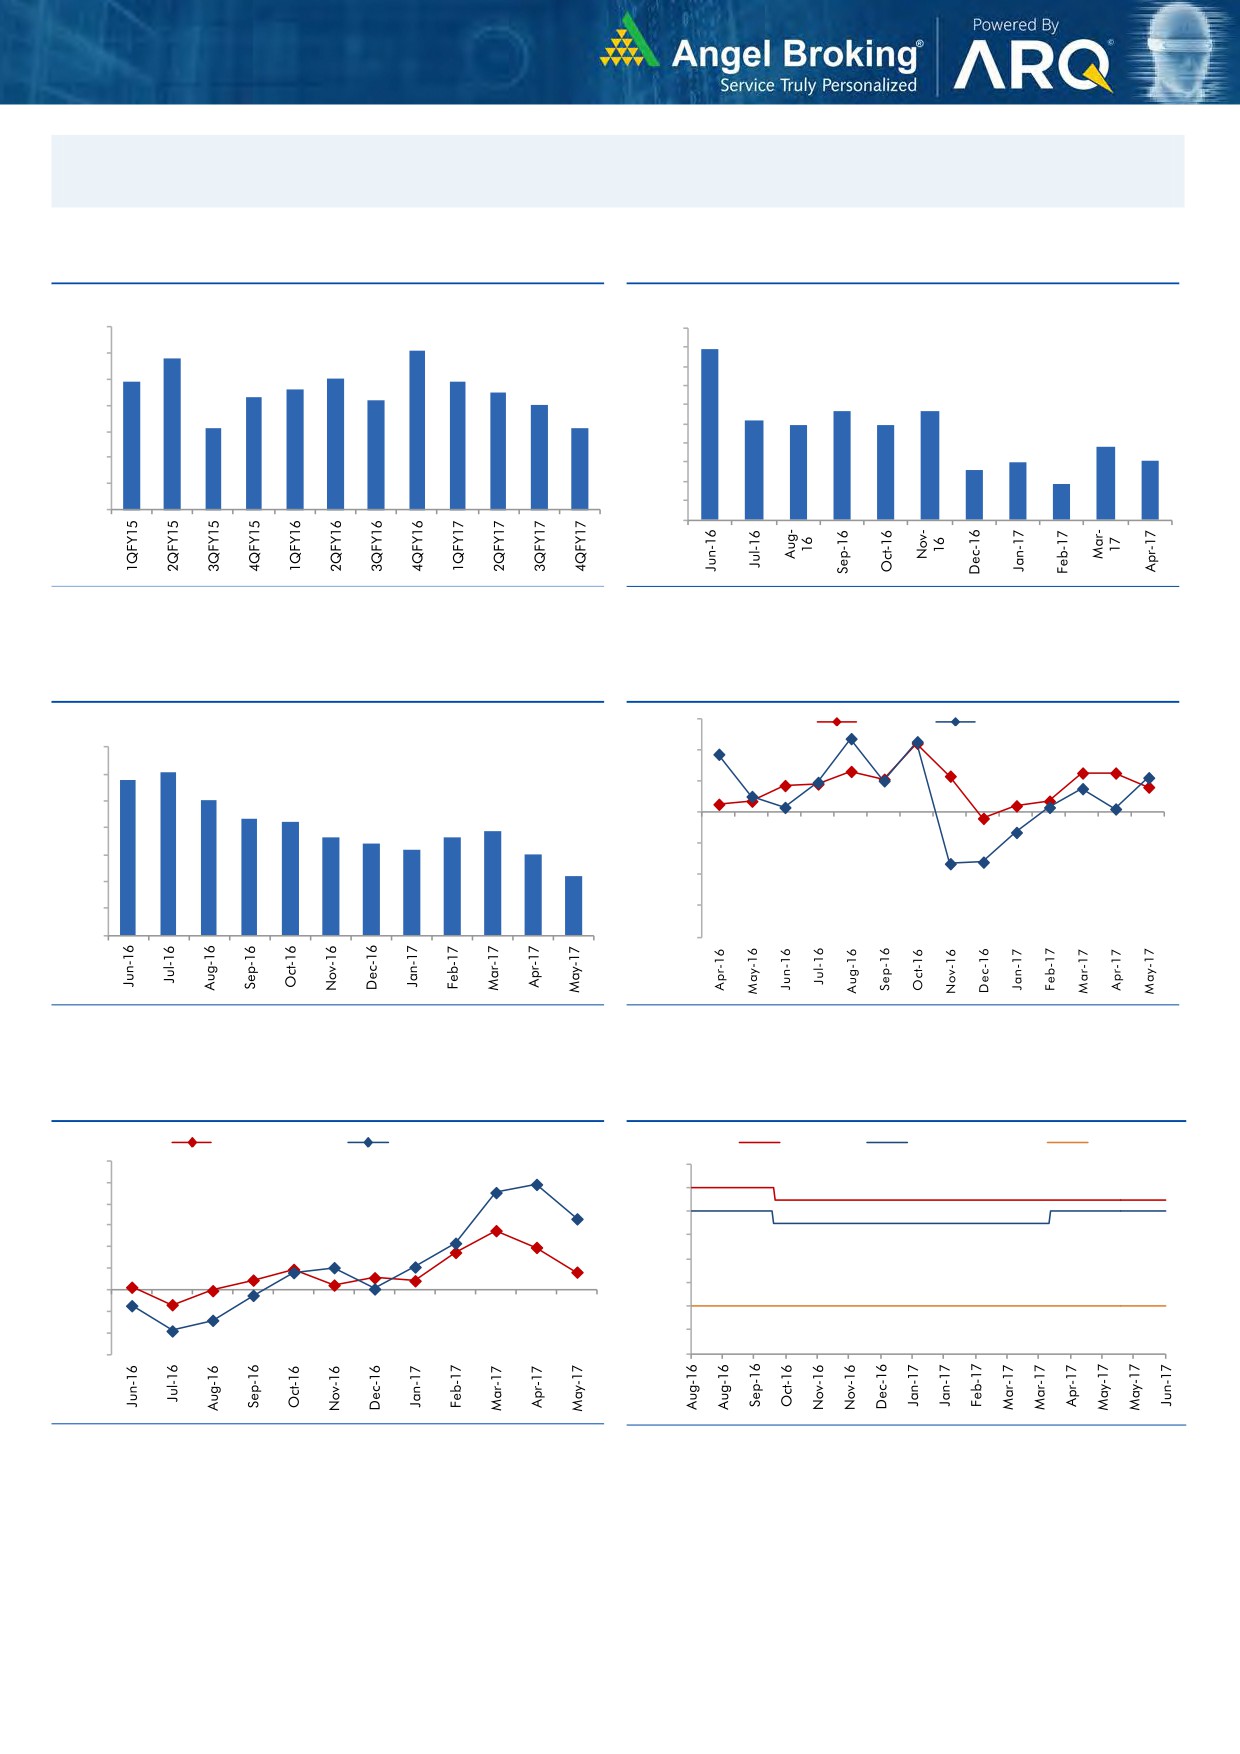
Macro watch
Exhibit 1: Quarterly GDP trends
Exhibit 2: IIP trends
(%)
(%)
10.0
10.0
9.1
8.9
8.8
9.0
9.0
7.9
8.0
7.9
8.0
7.6
7.5
8.0
7.3
7.2
7.0
7.0
5.7
5.7
7.0
6.0
5.2
6.1
6.1
4.9
4.9
5.0
6.0
3.8
4.0
3.0
3.1
5.0
2.6
3.0
1.9
4.0
2.0
1.0
3.0
-
Source: CSO, Angel Research
Source: MOSPI, Angel Research
Exhibit 3: Monthly CPI inflation trends
Exhibit 4: Manufacturing and services PMI
56.0
Mfg. PMI
Services PMI
(%)
7.0
54.0
6.1
5.8
6.0
5.1
52.0
5.0
4.3
4.2
3.9
50.0
3.6
3.7
4.0
3.4
3.2
3.0
48.0
3.0
2.2
46.0
2.0
1.0
44.0
-
42.0
Source: MOSPI, Angel Research
Source: Market, Angel Research; Note: Level above 50 indicates expansion
Exhibit 5: Exports and imports growth trends
Exhibit 6: Key policy rates
(%)
Exports yoy growth
Imports yoy growth
(%)
Repo rate
Reverse Repo rate
CRR
60.0
7.00
50.0
6.50
40.0
6.00
30.0
5.50
20.0
5.00
10.0
4.50
0.0
(10.0)
4.00
(20.0)
3.50
(30.0)
3.00
Source: Bloomberg, Angel Research
Source: RBI, Angel Research
Market Outlook
June 30, 2017
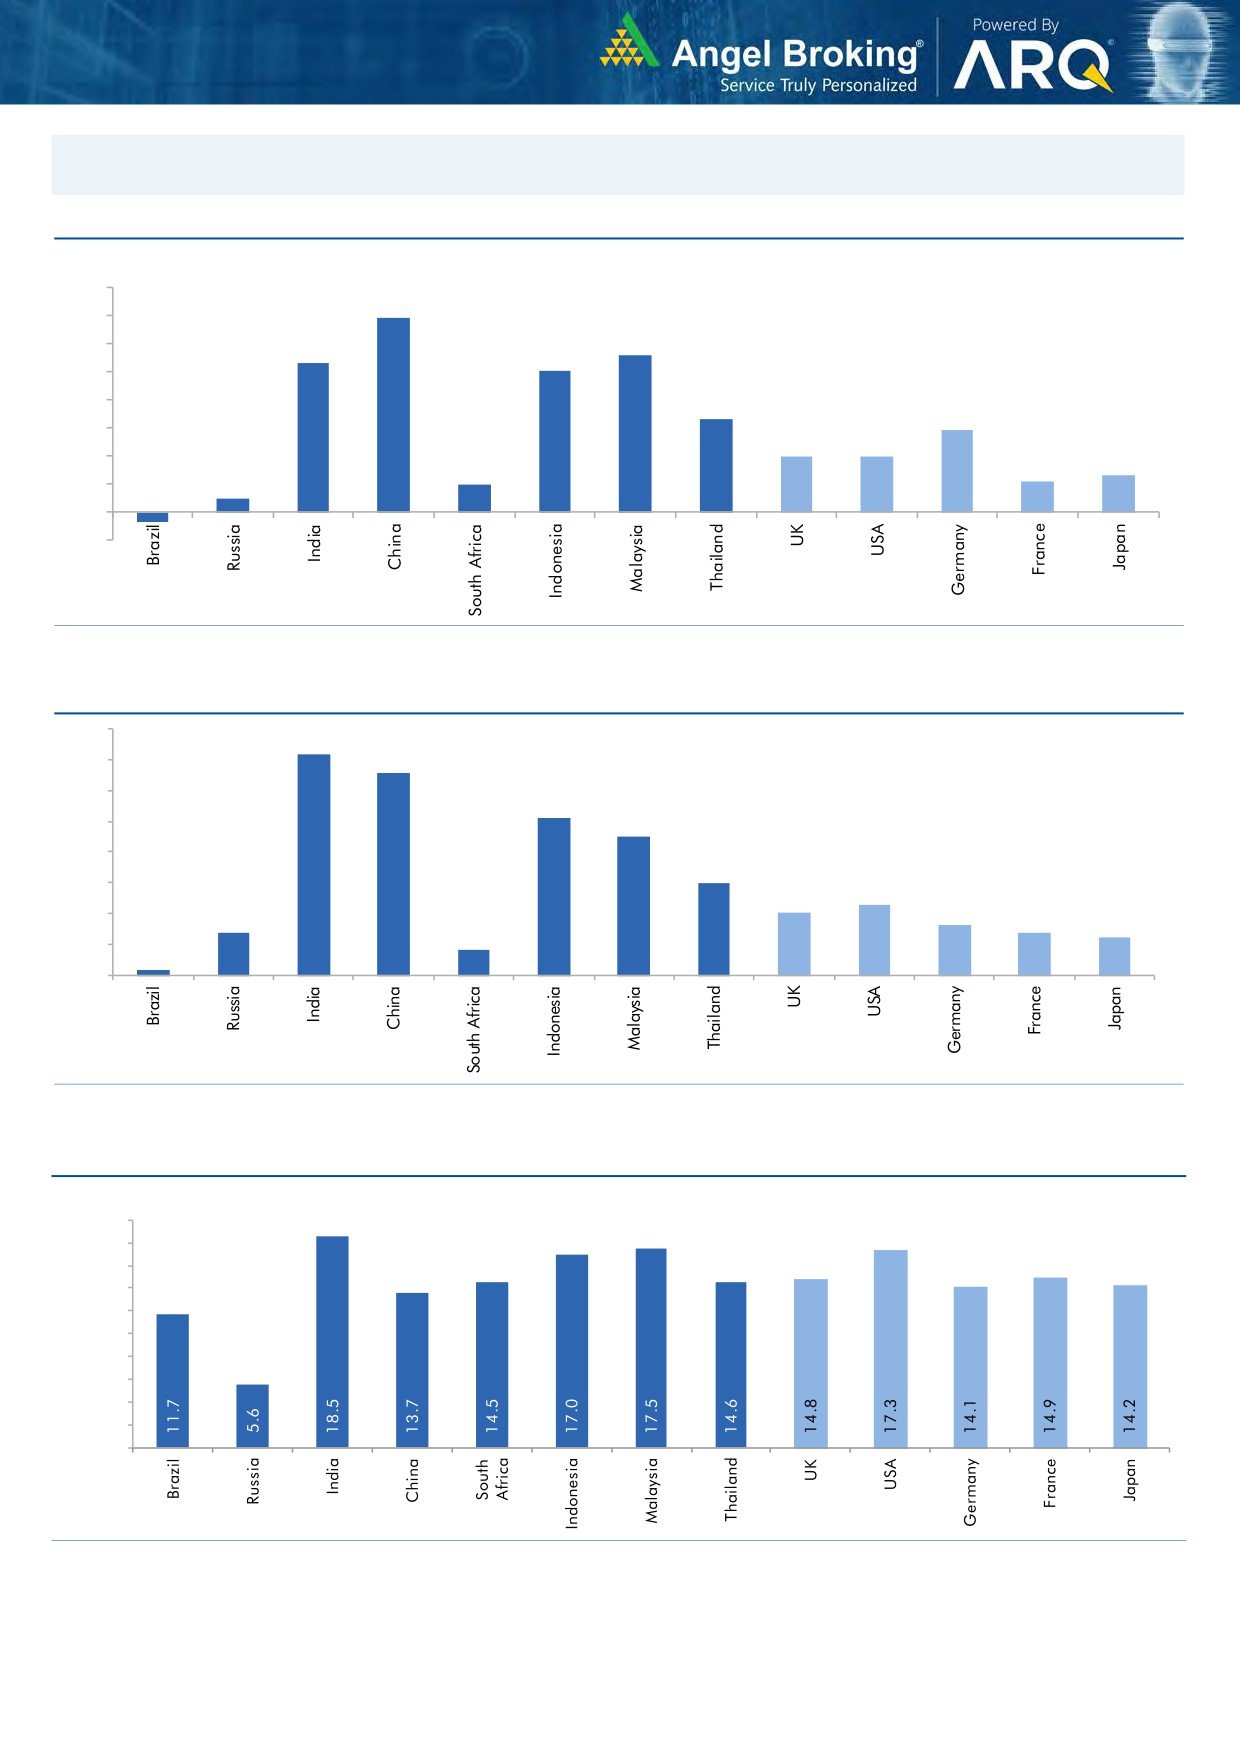
Global watch
Exhibit 1: Latest quarterly GDP Growth (%, yoy) across select developing and developed countries
(%)
8.0
6.9
7.0
5.6
6.0
5.3
5.0
1.0
5.0
4.0
3.3
2.9
3.0
2.0
2.0
0.5
2.0
1.1
1.3
1.0
-
(1.0)
(0.4)
Source: Bloomberg, Angel Research
Exhibit 2: 2016 GDP Growth projection by IMF (%, yoy) across select developing and developed countries
(%)
7.2
7.0
6.6
6.0
5.1
5.0
4.5
4.0
3.0
3.0
2.3
2.0
1.4
1.6
2.0
1.4
1.2
0.2
0.8
1.0
-
Source: IMF, Angel Research
Exhibit 3: One year forward P-E ratio across select developing and developed countries
(x)
20.0
18.0
16.0
14.0
12.0
10.0
8.0
6.0
4.0
2.0
-
Source: IMF, Angel Research
Market Outlook
June 30, 2017
Exhibit 4: Relative performance of indices across globe
Returns (%)
Country
Name of index
Closing price
1M
3M
1YR
Brazil
Bovespa
62,239
(3.2)
(2.9)
23.8
Russia
Micex
1,881
(2.7)
(6.2)
(0.4)
India
Nifty
9,504
(1.0)
5.1
14.9
China
Shanghai Composite
3,188
2.5
(2.5)
10.5
South Africa
Top 40
45,212
(4.3)
1.8
3.0
Mexico
Mexbol
49,198
(0.2)
0.1
8.5
Indonesia
LQ45
978
0.7
8.6
17.1
Malaysia
KLCI
1,771
(0.1)
1.5
9.1
Thailand
SET 50
995
0.4
(0.3)
10.3
USA
Dow Jones
21,287
1.8
3.6
21.2
UK
FTSE
7,350
(2.3)
0.8
11.7
Japan
Nikkei
20,220
2.8
5.3
25.9
Germany
DAX
12,416
(0.2)
5.1
32.2
France
CAC
5,154
(1.7)
3.3
26.6
Source: Bloomberg, Angel Research,
Stock Watch
June 30, 2017
Company Name
Reco
CMP
Target
Mkt Cap
Sales ( Čcr )
OPM(%)
EPS (Č)
PER(x)
P/BV(x)
RoE(%)
EV/Sales(x)
(Č)
Price ( Č)
( Č cr )
FY17E FY18E
FY17E
FY18E
FY17E
FY18E
FY17E
FY18E
FY17E
FY18E
FY17E
FY18E
FY17E
FY18E
Agri / Agri Chemical
Rallis
Reduce
241
209
4,679
1,937
2,164
13.3
14.3
9.0
11.0
26.7
21.9
4.7
4.1
18.4
19.8
2.5
2.2
United Phosphorus
Neutral
828
-
42,050
15,176
17,604
18.5
18.5
37.4
44.6
22.1
18.6
4.3
3.6
21.4
21.2
2.9
2.4
Auto & Auto Ancillary
Ashok Leyland
Buy
93
111
27,334
20,021
21,915
11.6
11.9
4.5
5.3
20.8
17.6
4.2
3.8
20.6
21.5
1.3
1.2
Bajaj Auto
Neutral
2,803
-
81,107
25,093
27,891
19.5
19.2
143.9
162.5
19.5
17.3
5.5
4.7
30.3
29.4
3.0
2.6
Bharat Forge
Neutral
1,076
-
25,050
7,726
8,713
20.5
21.2
35.3
42.7
30.5
25.2
5.6
5.1
18.9
20.1
3.3
2.9
Eicher Motors
Neutral
27,340
-
74,425
16,583
20,447
17.5
18.0
598.0
745.2
45.7
36.7
15.6
11.9
41.2
38.3
4.3
3.4
Gabriel India
Neutral
151
-
2,165
1,544
1,715
9.0
9.3
5.4
6.3
27.9
23.9
5.3
4.7
18.9
19.5
1.4
1.2
Hero Motocorp
Neutral
3,719
-
74,270
28,083
30,096
15.3
15.7
171.8
187.0
21.6
19.9
7.6
6.4
30.1
27.9
2.5
2.3
Jamna Auto Industries Neutral
238
-
1,894
1,486
1,620
9.8
9.9
15.0
17.2
15.9
13.8
3.5
2.9
21.8
21.3
1.3
1.2
L G Balakrishnan & Bros Neutral
746
-
1,170
1,302
1,432
11.6
11.9
43.7
53.0
17.1
14.1
2.4
2.2
13.8
14.2
1.0
0.9
Mahindra and Mahindra Neutral
1,356
-
84,205
46,534
53,077
11.6
11.7
67.3
78.1
20.1
17.4
3.3
2.9
15.4
15.8
1.8
1.5
Maruti
Neutral
7,223
-
218,180
67,822
83,288
16.0
16.4
253.8
312.4
28.5
23.1
6.5
5.3
23.0
22.9
2.9
2.3
Minda Industries
Neutral
628
-
5,429
2,728
3,042
9.0
9.1
68.2
86.2
9.2
7.3
2.1
1.7
23.8
24.3
2.1
1.8
Motherson Sumi
Neutral
457
-
64,135
45,896
53,687
7.8
8.3
13.0
16.1
35.0
28.4
11.3
9.0
34.7
35.4
1.5
1.2
Rane Brake Lining
Neutral
1,328
-
1,051
511
562
11.3
11.5
28.1
30.9
47.3
43.0
7.2
6.6
15.3
15.0
2.2
2.0
Setco Automotive
Neutral
37
-
494
741
837
13.0
13.0
15.2
17.0
2.4
2.2
0.4
0.4
15.8
16.3
1.1
1.0
Tata Motors
Neutral
436
-
125,874
300,209
338,549
8.9
8.4
42.7
54.3
10.2
8.0
1.6
1.4
15.6
17.2
0.5
0.5
TVS Motor
Neutral
545
-
25,873
13,390
15,948
6.9
7.1
12.8
16.5
42.7
32.9
10.6
8.4
26.3
27.2
2.0
1.6
Amara Raja Batteries
Buy
838
1,009
14,312
5,305
6,100
16.0
16.3
28.4
34.0
29.5
24.6
5.7
4.8
19.3
19.3
2.7
2.3
Exide Industries
Neutral
218
-
18,522
7,439
8,307
15.0
15.0
8.1
9.3
26.9
23.4
3.8
3.4
14.3
16.7
2.1
1.9
Apollo Tyres
Neutral
243
-
12,364
12,877
14,504
14.3
13.9
21.4
23.0
11.3
10.6
1.8
1.5
16.4
15.2
1.1
1.0
Ceat
Neutral
1,802
-
7,287
7,524
8,624
13.0
12.7
131.1
144.3
13.7
12.5
2.5
2.1
19.8
18.6
1.0
0.9
JK Tyres
Neutral
162
-
3,663
7,455
8,056
15.0
15.0
21.8
24.5
7.4
6.6
1.6
1.3
22.8
21.3
0.6
0.5
Swaraj Engines
Neutral
2,350
-
2,918
660
810
15.2
16.4
54.5
72.8
43.1
32.3
13.4
12.2
31.5
39.2
4.2
3.4
Subros
Neutral
240
-
1,440
1,488
1,681
11.7
11.9
6.4
7.2
37.5
33.5
4.0
3.6
10.8
11.4
1.2
1.0
Indag Rubber
Neutral
206
-
539
286
326
19.8
16.8
11.7
13.3
17.6
15.4
3.0
2.8
17.8
17.1
1.6
1.4
Capital Goods
ACE
Neutral
69
-
684
709
814
4.1
4.6
1.4
2.1
49.4
32.9
2.0
1.9
4.4
6.0
1.1
1.0
BEML
Neutral
1,458
-
6,070
3,451
4,055
6.3
9.2
31.4
57.9
46.4
25.2
2.8
2.5
6.3
10.9
1.9
1.6
Bharat Electronics
Neutral
160
-
35,738
8,137
9,169
16.8
17.2
58.7
62.5
2.7
2.6
0.4
0.4
44.6
46.3
3.4
3.0
Stock Watch
June 30, 2017
Company Name
Reco
CMP
Target
Mkt Cap
Sales ( Čcr )
OPM(%)
EPS (Č)
PER(x)
P/BV(x)
RoE(%)
EV/Sales(x)
(Č)
Price ( Č)
( Č cr )
FY17E
FY18E
FY17E
FY18E
FY17E
FY18E
FY17E
FY18E
FY17E
FY18E
FY17E
FY18E
FY17E
FY18E
Capital Goods
Voltas
Neutral
454
-
15,029
6,511
7,514
7.9
8.7
12.9
16.3
35.2
27.9
6.3
5.6
16.7
18.5
2.1
1.8
BGR Energy
Neutral
143
-
1,032
16,567
33,848
6.0
5.6
7.8
5.9
18.3
24.2
1.0
1.0
4.7
4.2
0.2
0.1
BHEL
Neutral
136
-
33,275
28,797
34,742
-
2.8
2.3
6.9
59.1
19.7
1.0
1.0
1.3
4.8
0.8
0.6
Blue Star
Buy
593
760
5,671
4,283
5,077
5.9
7.3
14.9
22.1
39.8
26.8
7.7
6.5
20.4
26.4
1.4
1.2
CG Power and Industrial
Neutral
81
-
5,067
5,777
6,120
5.9
7.0
3.3
4.5
24.5
18.0
1.1
1.0
4.4
5.9
0.8
0.7
Solutions
Greaves Cotton
Neutral
160
-
3,910
1,755
1,881
16.8
16.9
7.8
8.5
20.5
18.8
4.1
3.8
20.6
20.9
1.9
1.8
Inox Wind
Neutral
143
-
3,176
5,605
6,267
15.7
16.4
24.8
30.0
5.8
4.8
1.6
1.2
25.9
24.4
0.6
0.5
KEC International
Neutral
253
-
6,491
9,294
10,186
7.9
8.1
9.9
11.9
25.5
21.2
3.7
3.3
15.6
16.3
0.9
0.8
KEI Industries
Accumulate
231
258
1,800
2,633
3,001
10.4
10.0
12.7
13.0
18.2
17.8
3.9
3.2
21.4
18.2
0.9
0.8
Thermax
Neutral
940
-
11,200
5,421
5,940
7.3
7.3
25.7
30.2
36.6
31.1
4.4
4.0
12.2
13.1
2.0
1.8
VATech Wabag
Neutral
693
-
3,782
3,136
3,845
8.9
9.1
26.0
35.9
26.7
19.3
3.3
2.8
13.4
15.9
1.1
0.9
Cement
ACC
Neutral
1,580
-
29,671
11,225
13,172
13.2
16.9
44.5
75.5
35.5
20.9
3.4
3.1
11.2
14.2
2.6
2.3
Ambuja Cements
Neutral
246
-
48,897
9,350
10,979
18.2
22.5
5.8
9.5
42.5
25.9
3.6
3.2
10.2
12.5
5.2
4.5
India Cements
Neutral
199
-
6,132
4,364
4,997
18.5
19.2
7.9
11.3
25.2
17.6
1.8
1.8
8.0
8.5
2.2
1.9
JK Cement
Neutral
934
-
6,526
4,398
5,173
15.5
17.5
31.2
55.5
29.9
16.8
3.6
3.1
12.0
15.5
2.0
1.7
J K Lakshmi Cement
Neutral
483
-
5,689
2,913
3,412
14.5
19.5
7.5
22.5
64.5
21.5
4.0
3.3
12.5
18.0
2.5
2.1
Orient Cement
Neutral
139
-
2,848
2,114
2,558
18.5
20.5
8.1
11.3
17.2
12.3
2.5
2.1
9.0
14.0
2.0
1.5
UltraTech Cement
Neutral
3,950
-
108,427
25,768
30,385
21.0
23.5
111.0
160.0
35.6
24.7
4.5
4.0
13.5
15.8
4.3
3.6
Construction
ITNL
Neutral
96
-
3,156
8,946
10,017
31.0
31.6
8.1
9.1
11.9
10.5
0.4
0.4
4.2
5.0
3.7
3.4
KNR Constructions
Neutral
208
-
2,920
1,385
1,673
14.7
14.0
41.2
48.5
5.0
4.3
0.9
0.8
14.9
15.2
2.2
1.8
Larsen & Toubro
Neutral
1,702
-
158,905
111,017
124,908
11.0
11.0
61.1
66.7
27.9
25.5
3.4
3.1
13.1
12.9
2.5
2.3
Gujarat Pipavav Port
Neutral
145
-
7,010
705
788
52.2
51.7
5.0
5.6
29.0
25.9
2.9
2.6
11.2
11.2
9.6
8.1
Nagarjuna Const.
Neutral
89
-
4,948
8,842
9,775
9.1
8.8
5.3
6.4
16.8
13.9
1.3
1.2
8.2
9.1
0.7
0.6
PNC Infratech
Neutral
144
-
3,683
2,350
2,904
13.1
13.2
9.0
8.8
16.0
16.3
0.6
0.5
15.9
13.9
1.7
1.4
Simplex Infra
Neutral
505
-
2,501
6,829
7,954
10.5
10.5
31.4
37.4
16.1
13.5
1.7
1.5
9.9
13.4
0.8
0.7
Power Mech Projects
Neutral
585
-
861
1,801
2,219
12.7
14.6
72.1
113.9
8.1
5.1
1.5
1.3
16.8
11.9
0.5
0.4
Sadbhav Engineering
Neutral
307
-
5,272
3,598
4,140
10.3
10.6
9.0
11.9
34.1
25.8
3.6
3.1
9.9
11.9
1.8
1.5
NBCC
Neutral
204
-
18,387
7,428
9,549
7.9
8.6
8.2
11.0
24.9
18.6
1.2
1.0
28.2
28.7
2.2
1.6
MEP Infra
Neutral
111
-
1,806
1,877
1,943
30.6
29.8
3.0
4.2
37.0
26.5
17.9
12.1
0.6
0.6
2.3
2.2
Stock Watch
June 30, 2017
Company Name
Reco
CMP
Target
Mkt Cap
Sales ( Čcr )
OPM(%)
EPS (Č)
PER(x)
P/BV(x)
RoE(%)
EV/Sales(x)
(Č)
Price ( Č)
( Č cr )
FY17E
FY18E
FY17E
FY18E
FY17E
FY18E
FY17E
FY18E
FY17E
FY18E
FY17E
FY18E
FY17E
FY18E
Construction
SIPL
Neutral
108
-
3,790
1,036
1,252
65.5
66.2
(8.4)
(5.6)
4.0
4.6
(22.8)
(15.9)
11.9
9.9
Engineers India
Neutral
152
-
10,209
1,725
1,935
16.0
19.1
11.4
13.9
13.3
10.9
1.8
1.8
13.4
15.3
4.8
4.3
Financials
Axis Bank
Accumulate
512
580
122,648
46,932
53,575
3.5
3.4
32.4
44.6
15.8
11.5
2.0
1.8
13.6
16.5
-
-
Bank of Baroda
Neutral
156
-
35,830
19,980
23,178
1.8
1.8
11.5
17.3
13.5
9.0
1.6
1.3
8.3
10.1
-
-
Canara Bank
Neutral
332
-
19,824
15,225
16,836
1.8
1.8
14.5
28.0
22.9
11.9
1.6
1.3
5.8
8.5
-
-
Can Fin Homes
Neutral
3,194
-
8,502
420
526
3.5
3.5
86.5
107.8
36.9
29.6
8.0
6.5
23.6
24.1
-
-
Cholamandalam Inv. &
Accumulate
1,096
1,230
17,133
2,012
2,317
6.3
6.3
42.7
53.6
25.7
20.5
4.1
3.5
16.9
18.3
-
-
Fin. Co.
Dewan Housing Finance Buy
436
520
13,677
2,225
2,688
2.9
2.9
29.7
34.6
14.7
12.6
2.4
1.6
16.1
14.8
-
-
Equitas Holdings
Buy
150
235
5,065
939
1,281
11.7
11.5
5.8
8.2
25.8
18.3
2.2
2.0
10.9
11.5
-
-
Federal Bank
Accumulate
113
125
19,501
8,259
8,995
3.0
3.0
4.3
5.6
26.3
20.2
2.2
2.1
8.5
10.1
-
-
HDFC
Neutral
1,632
-
259,540
11,475
13,450
3.4
3.4
45.3
52.5
36.0
31.1
6.9
6.1
20.2
20.5
-
-
HDFC Bank
Neutral
1,662
-
426,912
46,097
55,433
4.5
4.5
58.4
68.0
28.5
24.4
5.0
4.2
18.8
18.6
-
-
ICICI Bank
Accumulate
294
315
188,345
42,800
44,686
3.1
3.3
18.0
21.9
16.3
13.4
2.2
2.1
11.1
12.3
-
-
Karur Vysya Bank
Accumulate
146
160
8,841
5,640
6,030
3.3
3.2
8.9
10.0
16.4
14.6
1.7
1.6
11.2
11.4
-
-
Lakshmi Vilas Bank
Neutral
199
-
3,816
3,339
3,799
2.7
2.8
11.0
14.0
18.1
14.2
1.9
1.7
11.2
12.7
-
-
LIC Housing Finance
Neutral
742
-
37,456
3,712
4,293
2.6
2.5
39.0
46.0
19.0
16.1
3.6
3.1
19.9
20.1
-
-
Punjab Natl.Bank
Neutral
138
-
29,302
23,532
23,595
2.3
2.4
6.8
12.6
20.3
10.9
3.1
2.2
3.3
6.5
-
-
RBL Bank
Neutral
502
-
18,890
1,783
2,309
2.6
2.6
12.7
16.4
39.5
30.6
4.3
3.9
12.8
13.3
-
-
Repco Home Finance
Neutral
812
-
5,080
388
457
4.5
4.2
30.0
38.0
27.1
21.4
4.5
3.8
18.0
19.2
-
-
South Ind.Bank
Neutral
28
-
5,004
6,435
7,578
2.5
2.5
2.7
3.1
10.3
9.0
1.3
1.1
10.1
11.2
-
-
St Bk of India
Neutral
273
-
235,267
88,650
98,335
2.6
2.6
13.5
18.8
20.2
14.5
1.9
1.7
7.0
8.5
-
-
Union Bank
Neutral
145
-
9,982
13,450
14,925
2.3
2.3
25.5
34.5
5.7
4.2
0.8
0.7
7.5
10.2
-
-
Yes Bank
Neutral
1,438
-
65,745
8,978
11,281
3.3
3.4
74.0
90.0
19.4
16.0
3.7
3.1
17.0
17.2
-
-
FMCG
Akzo Nobel India
Neutral
1,832
-
8,788
2,955
3,309
13.3
13.7
57.2
69.3
32.1
26.4
10.5
8.8
32.7
33.3
2.8
2.4
Asian Paints
Neutral
1,104
-
105,867
17,128
18,978
16.8
16.4
19.1
20.7
57.8
53.3
20.1
19.0
34.8
35.5
6.1
5.5
Britannia
Neutral
3,638
-
43,667
9,594
11,011
14.6
14.9
80.3
94.0
45.3
38.7
18.6
14.4
41.2
-
4.4
3.8
Colgate
Neutral
1,087
-
29,577
4,605
5,149
23.4
23.4
23.8
26.9
45.7
40.4
25.3
19.8
64.8
66.8
6.3
5.7
Dabur India
Neutral
290
-
51,137
8,315
9,405
19.8
20.7
8.1
9.2
35.8
31.6
10.0
8.3
31.6
31.0
5.8
5.1
GlaxoSmith Con*
Neutral
5,373
-
22,596
4,350
4,823
21.2
21.4
179.2
196.5
30.0
27.4
8.0
6.7
27.1
26.8
4.6
4.0
Stock Watch
June 30, 2017
Company Name
Reco
CMP
Target
Mkt Cap
Sales ( Čcr )
OPM(%)
EPS (Č)
PER(x)
P/BV(x)
RoE(%)
EV/Sales(x)
(Č)
Price ( Č)
( Č cr )
FY17E FY18E
FY17E
FY18E
FY17E
FY18E
FY17E
FY18E
FY17E
FY18E
FY17E
FY18E
FY17E
FY18E
FMCG
Godrej Consumer
Neutral
948
-
64,578
10,235
11,428
18.4
18.6
41.1
44.2
23.1
21.5
5.1
4.3
24.9
24.8
6.4
5.7
HUL
Neutral
1,088
-
235,429
35,252
38,495
17.8
17.8
20.7
22.4
52.7
48.6
50.3
43.2
95.6
88.9
6.5
6.0
ITC
Neutral
311
-
378,269
40,059
44,439
38.3
39.2
9.0
10.1
34.7
30.7
9.7
8.5
27.8
27.5
8.9
8.1
Marico
Neutral
312
-
40,276
6,430
7,349
18.8
19.5
6.4
7.7
48.8
40.5
14.7
12.4
33.2
32.5
6.1
5.3
Nestle*
Neutral
6,754
-
65,124
10,073
11,807
20.7
21.5
124.8
154.2
54.1
43.8
22.2
20.0
34.8
36.7
6.3
5.3
Tata Global
Neutral
149
-
9,372
8,675
9,088
9.8
9.8
7.4
8.2
20.1
18.1
1.6
1.5
7.9
8.1
1.0
0.9
Procter & Gamble
Neutral
7,993
-
25,945
2,939
3,342
23.2
23.0
146.2
163.7
54.7
48.8
13.8
11.5
25.3
23.5
8.4
7.3
Hygiene
IT
HCL Tech^
Buy
847
1,014
120,909
46,723
52,342
22.1
20.9
60.0
62.8
14.1
13.5
3.6
3.0
25.3
22.4
2.3
2.0
Infosys
Buy
930
1,179
213,501
68,484
73,963
26.0
26.0
63.0
64.0
14.8
14.5
3.1
2.8
20.8
19.7
2.8
2.5
TCS
Accumulate
2,335
2,651
460,026
117,966
127,403
27.5
27.6
134.3
144.5
17.4
16.2
5.2
4.8
29.8
29.7
3.5
3.3
Tech Mahindra
Buy
389
533
37,906
29,141
31,051
14.4
15.0
32.3
35.6
12.0
10.9
2.1
1.9
17.1
17.0
1.2
1.0
Wipro
Accumulate
259
280
126,155
55,421
58,536
20.3
20.3
35.1
36.5
7.4
7.1
1.3
1.1
19.2
14.6
1.7
1.5
Media
D B Corp
Neutral
376
-
6,908
2,297
2,590
27.4
28.2
21.0
23.4
17.9
16.1
4.2
3.6
23.7
23.1
2.8
2.4
HT Media
Neutral
81
-
1,886
2,693
2,991
12.6
12.9
7.9
9.0
10.3
9.0
0.9
0.8
7.8
8.3
0.3
0.2
Jagran Prakashan
Buy
182
225
5,961
2,283
2,555
28.0
28.0
10.6
12.3
17.2
14.9
3.7
3.2
21.4
21.4
2.6
2.3
Sun TV Network
Neutral
807
-
31,801
2,850
3,265
70.1
71.0
26.2
30.4
30.8
26.5
7.9
7.0
24.3
25.6
10.8
9.3
Hindustan Media
Neutral
273
-
2,000
1,016
1,138
24.3
25.2
27.3
30.1
10.0
9.1
1.9
1.7
16.2
15.8
1.3
1.1
Ventures
TV Today Network
Buy
238
344
1,420
608
667
21.5
22.3
15.7
19.2
15.2
12.4
2.3
2.0
16.1
16.0
1.9
1.7
Metals & Mining
Coal India
Neutral
245
-
152,206
84,638
94,297
21.4
22.3
24.5
27.1
10.0
9.1
4.2
4.0
42.6
46.0
1.3
1.2
Hind. Zinc
Neutral
261
-
110,471
14,252
18,465
55.9
48.3
15.8
21.5
16.6
12.2
2.7
2.4
17.0
20.7
7.8
6.0
Hindalco
Neutral
192
-
43,039
107,899
112,095
7.4
8.2
9.2
13.0
20.9
14.8
1.0
1.0
4.8
6.6
0.9
0.9
JSW Steel
Neutral
205
-
49,589
53,201
58,779
16.1
16.2
130.6
153.7
1.6
1.3
0.2
0.2
14.0
14.4
1.7
1.5
NMDC
Neutral
108
-
34,123
6,643
7,284
44.4
47.7
7.1
7.7
15.2
14.0
1.3
1.3
8.8
9.2
2.9
2.6
SAIL
Neutral
58
-
23,975
47,528
53,738
(0.7)
2.1
(1.9)
2.6
22.3
0.6
0.6
(1.6)
3.9
1.4
1.2
Vedanta
Neutral
251
-
93,376
71,744
81,944
19.2
21.7
13.4
20.1
18.8
12.5
1.6
1.4
8.4
11.3
1.7
1.3
Tata Steel
Neutral
535
-
51,931
121,374
121,856
7.2
8.4
18.6
34.3
28.8
15.6
1.8
1.6
6.1
10.1
1.1
1.0
Oil & Gas
GAIL
Neutral
362
-
61,166
56,220
65,198
9.3
10.1
27.1
33.3
13.4
10.9
1.2
1.1
9.3
10.7
1.3
1.1
ONGC
Neutral
158
-
202,637
137,222
152,563
15.0
21.8
19.5
24.1
8.1
6.6
0.7
0.7
8.5
10.1
1.8
1.6
Indian Oil Corp
Neutral
387
-
187,851
373,359
428,656
5.9
5.5
54.0
59.3
7.2
6.5
1.1
1.0
16.0
15.6
0.7
0.6
Stock Watch
June 30, 2017
Company Name
Reco
CMP
Target
Mkt Cap
Sales ( Čcr )
OPM(%)
EPS (Č)
PER(x)
P/BV(x)
RoE(%)
EV/Sales(x)
(Č)
Price ( Č)
( Č cr )
FY17E FY18E
FY17E
FY18E
FY17E
FY18E
FY17E
FY18E
FY17E
FY18E
FY17E
FY18E
FY17E
FY18E
Oil & Gas
Reliance Industries
Neutral
1,393
-
452,910
301,963
358,039
12.1
12.6
87.7
101.7
15.9
13.7
1.6
1.5
10.7
11.3
2.0
1.6
Pharmaceuticals
Alembic Pharma
Buy
503
648
9,490
3,101
3,966
19.7
20.5
21.4
25.5
23.5
19.7
5.0
4.1
23.0
22.8
3.0
2.2
Alkem Laboratories Ltd
Buy
1,856
2,161
22,194
5,853
6,901
17.1
18.4
74.6
85.0
24.9
21.8
5.3
4.4
21.1
20.2
3.8
3.2
Aurobindo Pharma
Buy
671
823
39,295
14,845
17,086
21.5
22.1
39.4
44.7
17.0
15.0
4.2
3.3
27.6
24.7
2.8
2.4
Aventis*
Neutral
4,150
-
9,558
2,206
2,508
16.6
16.8
128.9
139.9
32.2
29.7
5.5
4.3
21.6
23.5
4.1
3.4
Cadila Healthcare
Reduce
522
450
53,429
9,220
11,584
18.4
20.3
14.5
18.7
36.0
27.9
7.7
6.2
23.5
24.6
6.1
4.7
Cipla
Sell
545
461
43,828
14,281
16,619
15.4
16.2
12.5
19.7
43.6
27.7
3.5
3.2
8.4
12.0
3.2
2.8
Dr Reddy's
Neutral
2,646
-
43,858
14,081
15,937
16.1
18.6
72.6
105.9
36.5
25.0
3.6
3.2
9.6
13.6
3.3
3.0
Dishman Pharma
Sell
143
1,718
1,890
22.7
22.8
9.5
11.3
10.1
10.9
3.3
2.9
GSK Pharma*
Neutral
2,477
-
20,982
2,927
3,290
11.8
16.2
34.4
49.6
72.0
49.9
10.5
10.9
13.9
21.3
7.0
6.3
Indoco Remedies
Sell
192
153
1,771
1,067
1,154
12.1
14.9
8.4
11.3
22.9
17.0
2.7
2.4
12.6
15.0
1.9
1.7
Ipca labs
Buy
480
620
6,057
3,211
3,593
13.9
14.5
15.4
19.4
31.2
24.7
2.5
2.3
8.2
9.5
2.0
1.8
Lupin
Buy
1,056
1,526
47,715
17,120
18,657
24.1
24.1
56.9
61.1
18.6
17.3
3.5
3.0
20.7
18.6
3.1
2.5
Natco Pharma
Accumulate
938
1,060
16,342
2,065
1,988
33.1
33.7
27.9
25.7
33.6
36.5
9.8
8.3
29.2
22.9
8.0
8.1
Sun Pharma
Buy
539
712
129,199
30,264
32,899
29.0
26.9
32.7
31.6
16.5
17.0
3.5
3.0
22.2
18.7
4.0
3.6
Power
Tata Power
Neutral
82
-
22,044
36,916
39,557
17.4
27.1
5.1
6.3
16.0
12.9
1.4
1.3
9.0
10.3
1.6
1.4
NTPC
Neutral
158
-
130,402
86,605
95,545
17.5
20.8
11.8
13.4
13.4
11.8
1.4
1.3
10.5
11.1
2.8
2.8
Power Grid
Accumulate
208
223
108,739
25,315
29,193
88.2
88.7
14.2
17.2
14.7
12.1
2.2
1.9
15.2
16.1
8.9
8.0
Real Estate
Prestige Estate
Neutral
240
-
8,991
4,707
5,105
25.2
26.0
10.3
13.0
23.3
18.4
1.9
1.7
10.3
10.2
3.1
2.7
MLIFE
Buy
431
522
2,213
1,152
1,300
22.7
24.6
29.9
35.8
14.4
12.0
1.1
1.0
7.6
8.6
2.6
2.2
Telecom
Bharti Airtel
Neutral
383
-
152,941
105,086
114,808
34.5
34.7
12.2
16.4
31.4
23.3
2.1
2.0
6.8
8.4
2.4
2.1
Idea Cellular
Neutral
84
-
30,381
40,133
43,731
37.2
37.1
6.4
6.5
13.2
13.0
1.1
1.0
8.2
7.6
1.8
1.5
zOthers
Abbott India
Neutral
4,223
-
8,973
3,153
3,583
14.1
14.4
152.2
182.7
27.8
23.1
136.2
116.3
25.6
26.1
2.6
2.2
Asian Granito
Accumulate
424
447
1,276
1,066
1,169
11.6
12.5
13.0
16.0
32.6
26.5
3.2
2.8
9.5
10.7
1.5
1.3
Bajaj Electricals
Buy
332
395
3,362
4,801
5,351
5.7
6.2
10.4
13.7
31.9
24.3
3.9
3.5
12.4
14.5
0.7
0.6
Banco Products (India)
Neutral
218
-
1,559
1,353
1,471
12.3
12.4
14.5
16.3
15.0
13.4
20.8
18.7
14.5
14.6
1.1
117.4
Coffee Day Enterprises
Neutral
245
-
5,048
2,964
3,260
20.5
21.2
4.7
8.0
-
30.6
2.8
2.6
5.5
8.5
2.1
1.9
Ltd
Competent Automobiles Neutral
173
-
111
1,137
1,256
3.1
2.7
28.0
23.6
6.2
7.3
33.3
30.1
14.3
11.5
0.1
0.1
Elecon Engineering
Neutral
56
-
633
1,482
1,660
13.7
14.5
3.9
5.8
14.5
9.7
3.4
3.1
7.8
10.9
0.7
0.7
Stock Watch
June 30, 2017
Company Name
Reco
CMP
Target
Mkt Cap
Sales ( Čcr )
OPM(%)
EPS (Č)
PER(x)
P/BV(x)
RoE(%)
EV/Sales(x)
(Č)
Price ( Č)
( Č cr )
FY17E
FY18E
FY17E
FY18E
FY17E
FY18E
FY17E
FY18E
FY17E
FY18E
FY17E
FY18E
FY17E
FY18E
zOthers
Finolex Cables
Neutral
461
-
7,046
2,883
3,115
12.0
12.1
14.2
18.6
32.4
24.8
17.3
15.1
15.8
14.6
2.1
1.9
Garware Wall Ropes
Neutral
811
-
1,775
863
928
15.1
15.2
36.4
39.4
22.3
20.6
4.0
3.4
17.5
15.9
2.0
1.8
Goodyear India*
Neutral
884
-
2,039
1,598
1,704
10.4
10.2
49.4
52.6
17.9
16.8
82.6
72.5
18.2
17.0
1.0
137.1
Hitachi
Neutral
2,001
-
5,440
2,081
2,433
8.8
8.9
33.4
39.9
59.9
50.2
48.3
40.3
22.1
21.4
2.6
2.2
HSIL
Neutral
367
-
2,655
2,384
2,515
15.8
16.3
15.3
19.4
24.0
18.9
23.9
20.5
7.8
9.3
1.3
1.2
Interglobe Aviation
Neutral
1,237
-
44,730
21,122
26,005
14.5
27.6
110.7
132.1
11.2
9.4
66.9
47.8
168.5
201.1
2.1
1.7
Jyothy Laboratories
Neutral
351
-
6,370
1,440
2,052
11.5
13.0
8.5
10.0
41.3
35.1
10.0
9.3
18.6
19.3
4.7
3.3
Kirloskar Engines India
Neutral
400
-
5,785
2,554
2,800
9.9
10.0
10.5
12.1
38.1
33.1
15.9
15.0
10.7
11.7
1.9
1.7
Ltd
Linc Pen & Plastics
Neutral
273
-
404
382
420
9.3
9.5
13.5
15.7
20.3
17.4
3.5
3.0
17.1
17.3
1.1
1.0
M M Forgings
Neutral
613
-
740
546
608
20.4
20.7
41.3
48.7
14.9
12.6
84.0
74.4
16.6
17.0
1.2
1.1
Manpasand Bever.
Neutral
774
-
4,428
836
1,087
19.6
19.4
16.9
23.8
45.8
32.5
5.5
4.8
12.0
14.8
5.0
3.8
Mirza International
Neutral
151
-
1,815
963
1,069
17.2
18.0
6.1
7.5
24.6
20.1
3.8
3.2
15.0
15.7
2.1
1.9
MT Educare
Neutral
63
-
250
366
417
17.7
18.2
9.4
10.8
6.7
5.8
1.5
1.3
22.2
22.3
0.6
0.5
Narayana Hrudaya
Neutral
315
-
6,428
1,873
2,166
11.5
11.7
2.6
4.0
118.9
79.3
7.3
6.6
6.1
8.3
3.5
3.0
Navkar Corporation
Buy
212
265
3,024
347
371
43.2
37.3
6.7
6.0
31.8
35.4
2.2
2.0
6.2
10.6
9.8
9.2
Navneet Education
Neutral
174
-
4,053
1,062
1,147
24.0
24.0
6.1
6.6
28.5
26.2
5.9
5.2
20.6
19.8
3.9
3.6
Nilkamal
Neutral
1,890
-
2,820
1,995
2,165
10.7
10.4
69.8
80.6
27.1
23.5
108.0
93.8
16.6
16.5
1.4
1.3
Page Industries
Neutral
16,238
-
18,112
2,450
3,124
20.1
17.6
299.0
310.0
54.3
52.4
361.7
276.1
47.1
87.5
7.4
5.9
Parag Milk Foods
Neutral
218
-
1,836
1,919
2,231
9.3
9.6
9.5
12.9
23.1
16.9
3.6
3.0
15.5
17.5
1.1
0.9
Quick Heal
Neutral
209
-
1,463
408
495
27.3
27.0
7.7
8.8
27.0
23.7
2.5
2.5
9.3
10.6
2.7
2.3
Radico Khaitan
Buy
123
147
1,632
1,667
1,824
13.0
13.2
6.7
8.2
18.4
15.0
1.7
1.5
9.0
10.2
1.4
1.2
Relaxo Footwears
Neutral
470
-
5,652
2,085
2,469
9.2
8.2
7.6
8.0
62.2
59.2
24.1
20.6
17.9
18.8
2.8
2.4
S H Kelkar & Co.
Neutral
267
-
3,867
1,036
1,160
15.1
15.0
6.1
7.2
43.8
37.3
4.7
4.3
10.7
11.5
3.6
3.2
Siyaram Silk Mills
Buy
2,000
2,500
1,875
1,574
1,769
12.5
12.7
97.1
113.1
20.6
17.7
3.2
2.7
15.4
15.5
1.4
1.2
Styrolution ABS India*
Neutral
826
-
1,452
1,440
1,537
9.2
9.0
40.6
42.6
20.3
19.4
51.9
47.2
12.3
11.6
1.0
0.9
Surya Roshni
Neutral
283
-
1,239
3,342
3,625
7.8
7.5
17.3
19.8
16.4
14.3
31.1
24.9
10.5
10.8
0.6
0.6
Team Lease Serv.
Neutral
1,337
-
2,287
3,229
4,001
1.5
1.8
22.8
32.8
58.7
40.7
6.3
5.5
10.7
13.4
0.6
0.5
The Byke Hospitality
Neutral
185
-
743
287
384
20.5
20.5
7.6
10.7
24.4
17.3
5.1
4.1
20.7
23.5
2.6
1.9
Transport Corporation of
Neutral
321
-
2,461
2,671
2,911
8.5
8.8
13.9
15.7
23.2
20.5
3.2
2.8
13.7
13.8
1.0
0.9
India
Stock Watch
June 30, 2017
Company Name
Reco
CMP
Target Mkt Cap
Sales ( Čcr )
OPM(%)
EPS (Č)
PER(x)
P/BV(x)
RoE(%)
EV/Sales(x)
(Č)
Price ( Č)
( Č cr )
FY17E FY18E FY17E FY18E FY17E FY18E FY17E FY18E FY17E FY18E FY17E FY18E FY17E FY18E
zOthers
TVS Srichakra
Neutral
3,808
-
2,916
2,304
2,614
13.7
13.8
231.1
266.6
16.5
14.3
427.9
336.9
33.9
29.3
1.3
1.1
UFO Moviez
Neutral
397
-
1,096
619
685
33.2
33.4
30.0
34.9
13.3
11.4
1.8
1.6
13.8
13.9
1.5
1.2
Visaka Industries
Neutral
513
-
814
1,051
1,138
10.3
10.4
21.0
23.1
24.4
22.2
65.7
61.6
9.0
9.2
1.0
1.0
VRL Logistics
Neutral
329
-
3,003
1,902
2,119
16.7
16.6
14.6
16.8
22.6
19.6
5.0
4.4
21.9
22.2
1.7
1.5
VIP Industries
Buy
184
218
2,602
1,270
1,450
10.4
10.4
5.6
6.5
32.9
28.3
6.8
5.9
20.7
21.1
2.0
1.8
Navin Fluorine
Buy
3,054
3,650
3,005
789
945
21.1
22.4
120.1
143.4
25.4
21.3
4.1
3.5
17.8
18.5
3.7
3.0
Source: Company, Angel Research; Note: *December year end; #September year end; &October year end; Price as on June 29, 2017
Market Outlook
June 30, 2017
Research Team Tel: 022 - 39357800
DISCLAIMER
Angel Broking Private Limited (hereinafter referred to as “Angel”) is a registered Member of National Stock Exchange of India
Limited,Bombay Stock Exchange Limited and Metropolitan Stock Exchange Limited. It is also registered as a Depository Participant with
CDSL and Portfolio Manager with SEBI. It also has registration with AMFI as a Mutual Fund Distributor. Angel Broking Private Limited is a
registered entity with SEBI for Research Analyst in terms of SEBI (Research Analyst) Regulations, 2014 vide registration number
INH000000164. Angel or its associates has not been debarred/ suspended by SEBI or any other regulatory authority for accessing
/dealing in securities Market. Angel or its associates/analyst has not received any compensation / managed or
co-managed public offering of securities of the company covered by Analyst during the past twelve months.
This document is solely for the personal information of the recipient, and must not be singularly used as the basis of any investment
decision. Nothing in this document should be construed as investment or financial advice. Each recipient of this document should make
such investigations as they deem necessary to arrive at an independent evaluation of an investment in the securities of the companies
referred to in this document (including the merits and risks involved), and should consult their own advisors to determine the merits and
risks of such an investment.
Reports based on technical and derivative analysis center on studying charts of a stock's price movement, outstanding positions and
trading volume, as opposed to focusing on a company's fundamentals and, as such, may not match with a report on a company's
fundamentals. Investors are advised to refer the Fundamental and Technical Research Reports available on our website to evaluate the
contrary view, if any.
The information in this document has been printed on the basis of publicly available information, internal data and other reliable
sources believed to be true, but we do not represent that it is accurate or complete and it should not be relied on as such, as this
document is for general guidance only. Angel Broking Pvt. Limited or any of its affiliates/ group companies shall not be in any way
responsible for any loss or damage that may arise to any person from any inadvertent error in the information contained in this report.
Angel Broking Pvt. Limited has not independently verified all the information contained within this document. Accordingly, we cannot
testify, nor make any representation or warranty, express or implied, to the accuracy, contents or data contained within this document.
While Angel Broking Pvt. Limited endeavors to update on a reasonable basis the information discussed in this material, there may be
regulatory, compliance, or other reasons that prevent us from doing so.
This document is being supplied to you solely for your information, and its contents, information or data may not be reproduced,
redistributed or passed on, directly or indirectly.
Neither Angel Broking Pvt. Limited, nor its directors, employees or affiliates shall be liable for any loss or damage that may arise from
or in connection with the use of this information.